7 October 2026
What is ground disturbance analysis in satellite imagery?
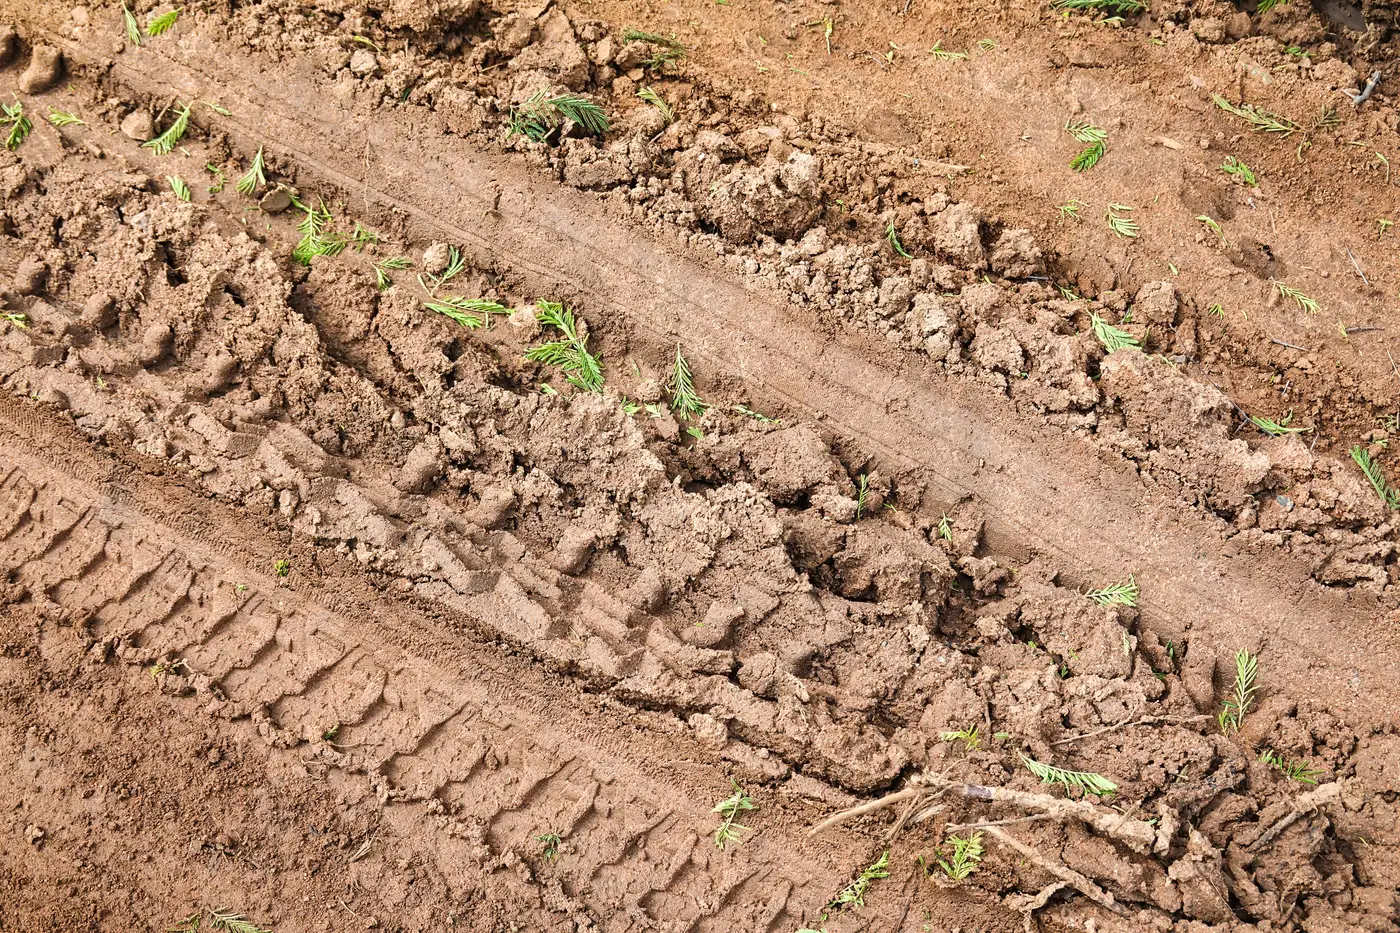
Ground disturbance analysis in satellite imagery compares the dirt around a piece of equipment between two dates and checks for the physical evidence of work: fresh tire ruts, graded soil, a stockpile that's shifted shape, vegetation stripped back where a machine dug in. It's the ground under scrutiny, not the machine's paint job.
For a rental fleet without telematics on every unit, or with telematics you don't fully trust, that's the proxy for utilization. If the ground around a skid steer looks the same in April as it did in March, the ground wasn't worked. The machine parked.
How it actually works
Satellite or aerial imagery at very high resolution, sub-half-meter, gets pulled for the same yard or site on two different dates, typically a week apart. The two passes get compared in the area immediately around each tracked asset. New wheel tracks, a graded patch that wasn't there before, a laydown area churned up versus one that's grown weeds since the last pass: that's what the comparison picks up.
That's the soil disturbance detection piece, and it's a blunter, more reliable signal than trying to infer activity from a GPS ping that might just mean the engine idled for an hour while nobody touched the controls.
Why before-and-after imagery beats a single snapshot
A single pass over a site tells you where equipment sits. It doesn't tell you whether that excavator has turned a shovel of dirt in three weeks. You need the comparison. Before and after site imagery, captured on a fixed cadence like weekly, is what turns a static inventory photo into an activity signal. One frame shows parked. Two frames, compared, shows idle versus working.
This matters most for the units nobody's watching closely: the compactor sitting at the back of a laydown yard, the generator that got dropped at a site six weeks ago and never heard from again. Telematics, where it exists, gives you engine hours and a location pin. It doesn't always tell you whether those hours match actual work on the ground, and a meaningful share of a rental fleet doesn't carry telematics at all, especially older attachments and trailer-mounted units.
Manual windshield surveys catch some of this. A yard manager drives the lot, eyeballs which units look like they've been sitting, flags a few for a closer look. It works for one yard on one day. It doesn't scale across a regional footprint, and it's easy to miss a unit parked just off the usual walking route.
Ground disturbance analysis run across every yard on a weekly cadence covers both gaps: no telematics required, and nobody has to physically walk the lot. The output is a flag, idle or active, per asset, per location, based on what changed in the ground around it between passes.
What this doesn't replace
Worth being straightforward about the limits. This method reads RGB imagery, not thermal, so it won't tell you an engine's running. It reads disturbance in the ground, not a machine-specific activity log, so a unit that got repositioned without doing any work can read differently than one that sat dead still while material got loaded and unloaded around it. At a sub-half-meter resolution on a weekly refresh, it's built to catch a utilization pattern across the fleet, not a single day's activity that got cleaned up before the next pass.
This answers the question most fleet ops managers want answered: which units across which yards haven't moved dirt in the last couple of weeks, and are candidates for redeployment or sale.
If you're reconciling telematics gaps or trying to retire a rotation of site visits, Asset Utilisation Monitor builds that idle-versus-active map layer straight from imagery. See what it would flag across your yards.